Dashboard Preview

When every minute counts, firefighters shouldn't fight their tools.

Flame Tracker: a unified command dashboard for wildfire response teams, replacing disconnected tools with one clear interface.

My Role

UX & Product Designer

Scope

Research, UX, UI, Prototyping

Timeline

4 weeks

Tools

Figma, Figjam

THE CONTEXT

A friend asked me a question I couldn't stop thinking about.

A close friend works at a company building IoT sensor networks for ultra-early wildfire detection. Their sensors can detect a fire before flames even appear. One day, he described what happens after detection: response teams juggling disconnected platforms, critical data scattered across tools, decisions made under extreme pressure with incomplete information.

What if there was one place where a response team could see everything they need and act on it?

That question became Flame Tracker: a concept project exploring how design could bring clarity to one of the most chaotic, high-stakes environments imaginable.

THE PROBLEM

Response teams were drowning in tools, not information.

Through desk research and conversations about real operational workflows, a clear pattern emerged: the problem wasn't a lack of data. It was fragmentation.

Fragmented tooling

Firefighters navigate between 3 to 5 disconnected systems during a single incident, each with different interfaces and data formats.

Context switching under pressure

Every tool switch costs cognitive load. In time-critical scenarios, these micro-delays compound into real risk.

No single source of truth

Incident commanders often make decisions based on partial information because aggregating data manually takes too long.

Communication gaps

Field teams and command centers frequently operate on different versions of the same situation.

"The user must access critical information within 10 minutes, often in the complete absence of structure."
Before

📡SensorMonitoring
🌤️WeatherService
📋ResourceManagement
💬TeamCommunication

4 disconnected tools

UNIFIED

After

One dashboard. Five capabilities.

1 unified interface

Before

📡SensorMonitoring
🌤️WeatherService
📋ResourceManagement
💬TeamCommunication

4 disconnected tools

UNIFIED

After

Monitor, Assess, Prioritize, Act, Communicate

1 unified interface

The Project Delivery

"How might we consolidate fragmented wildfire response tools into a single interface that helps teams monitor, assess, and act without information overload?"

This meant designing for two seemingly opposite goals: comprehensive information access and extreme cognitive simplicity.

What

Monitor fire incidents, sensor alerts, and environmental changes in real time from a single view.

Source

Aggregate data from IoT sensors, weather services, terrain mapping, and team communications.

Place

A map-centered interface where location is meaning and spatial awareness drives every decision.

DESIGNING FOR REAL ALERTS

The map is the gateway.

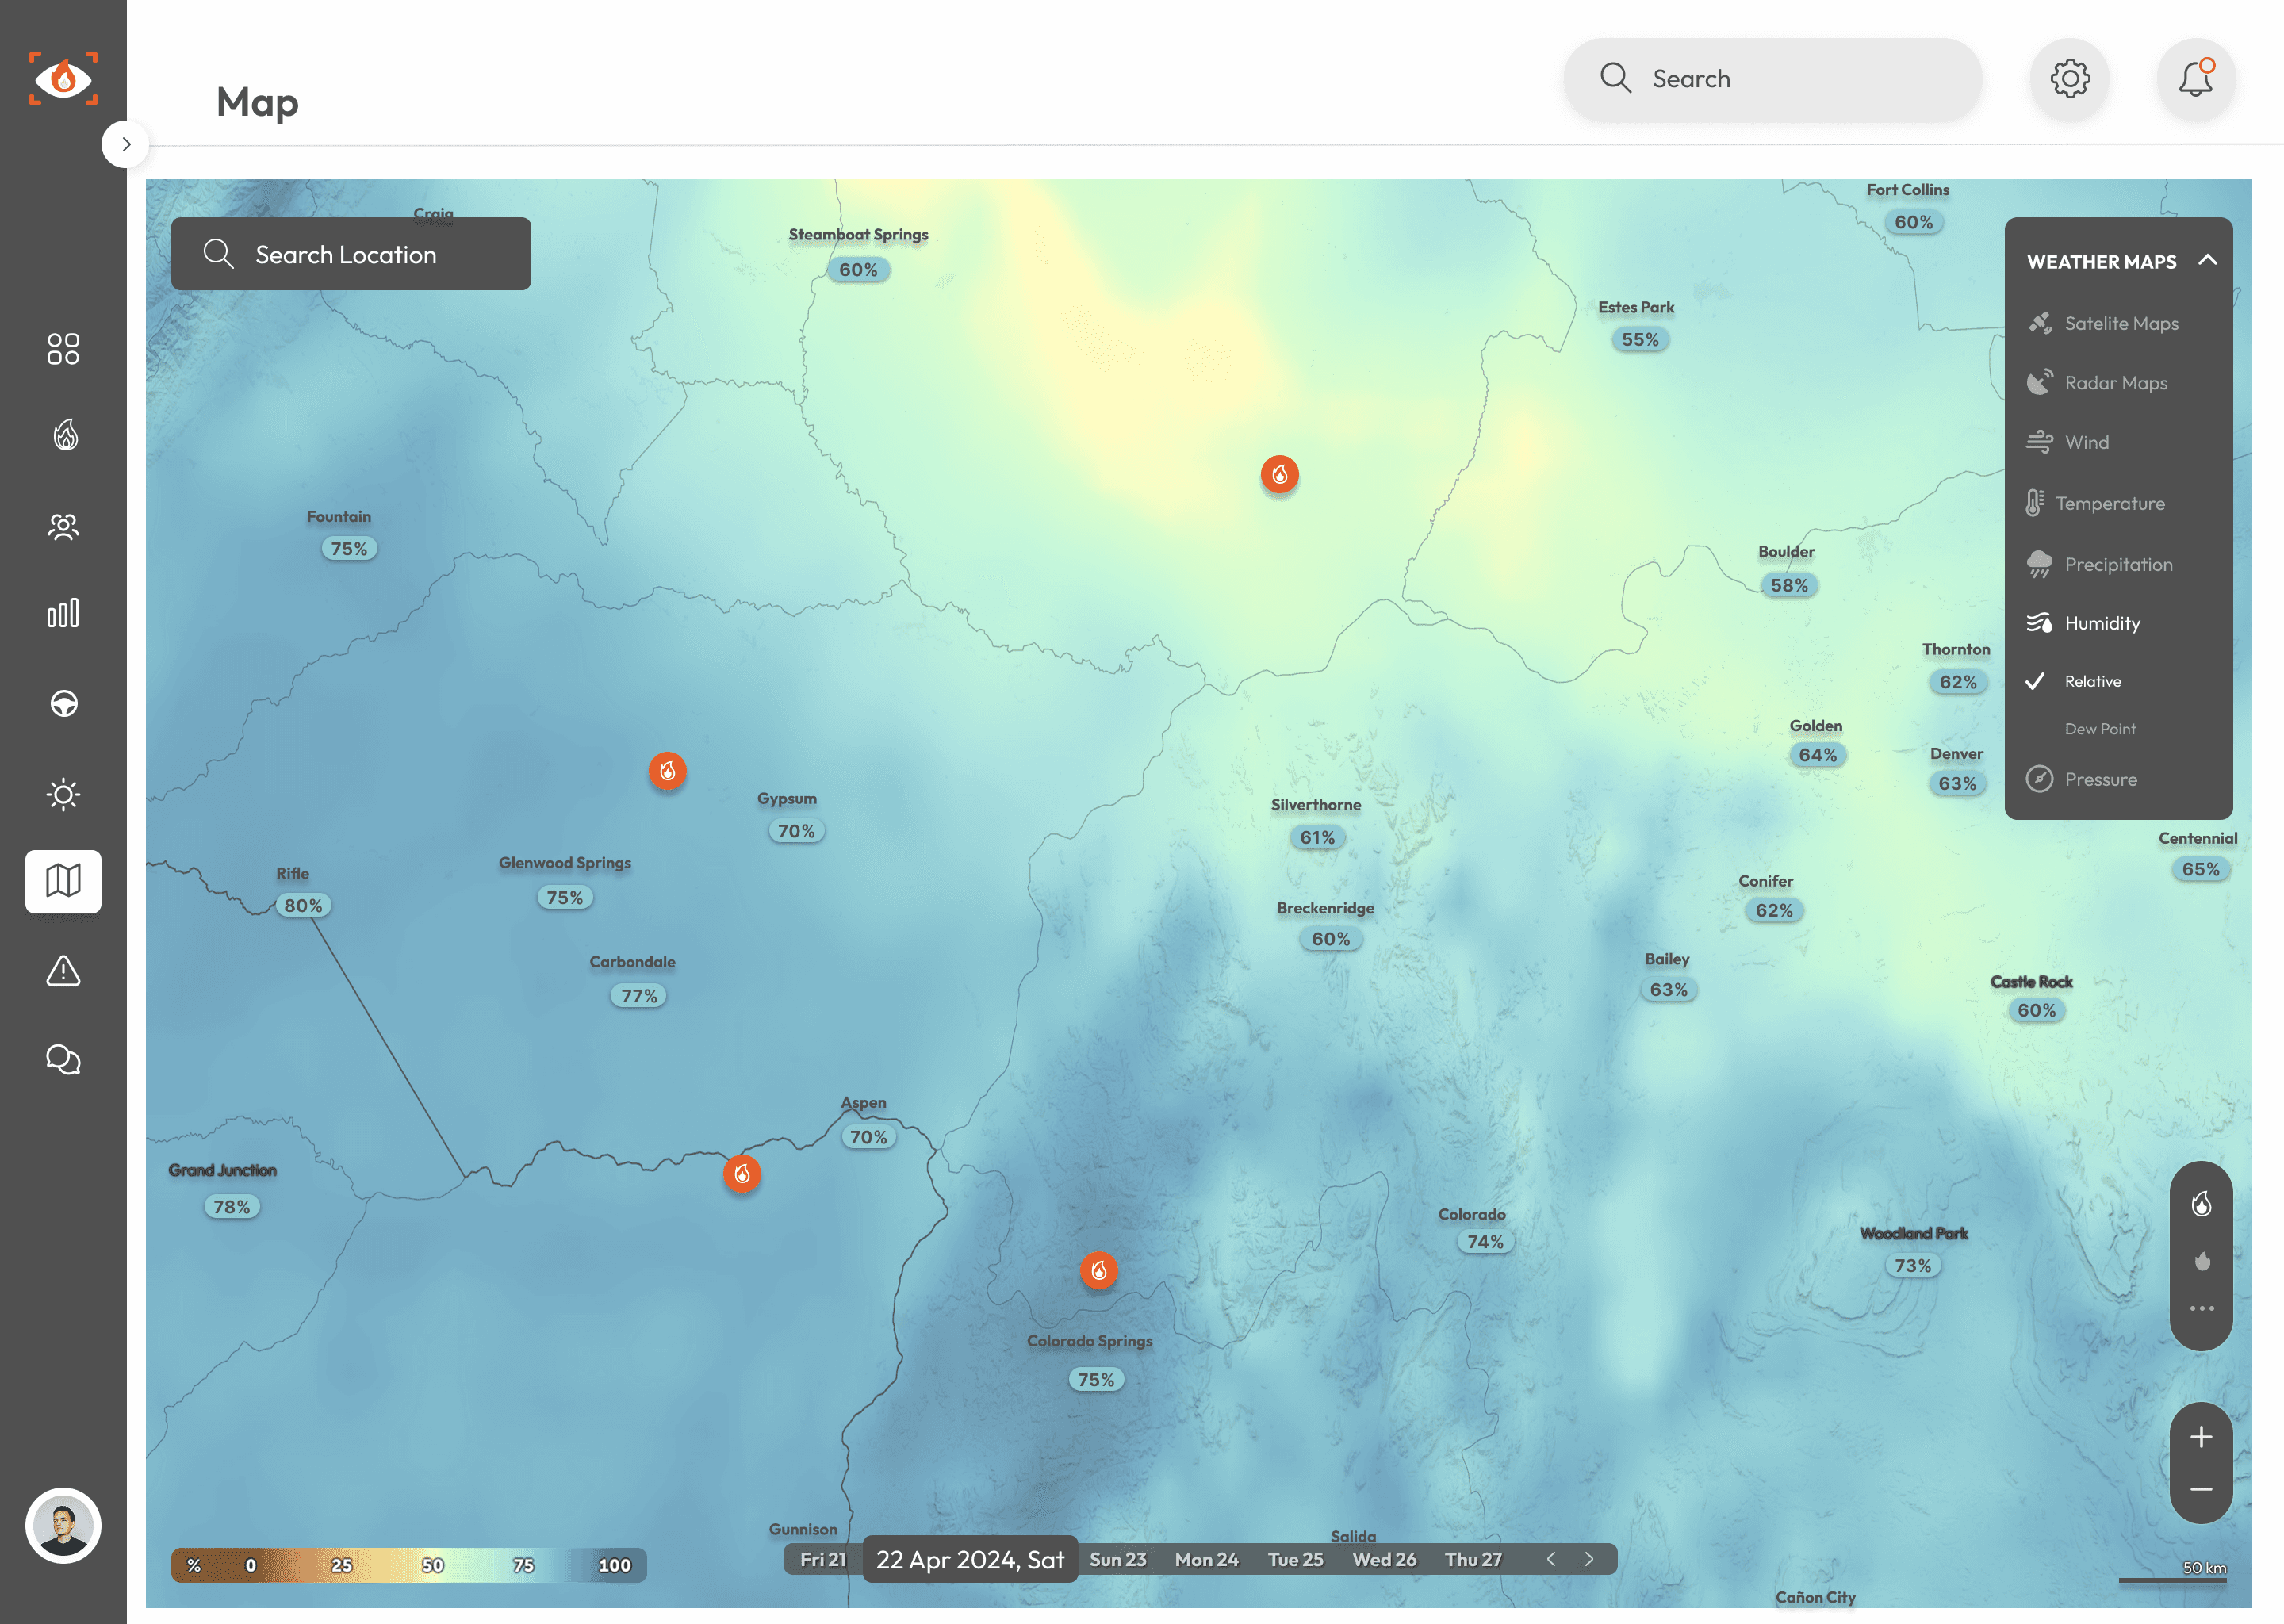
Emergency responders need to see the full picture before they can act. The map reveals information in layers, each using a carefully chosen color palette designed to remain readable when overlaid.

Temperature map
Temperature / Weather MapHeat distribution across the region. Helps assess fire spread risk based on ambient conditions.
Temperature map
Temperature / Weather MapHeat distribution across the region. Helps assess fire spread risk based on ambient conditions.

The map as the primary surface

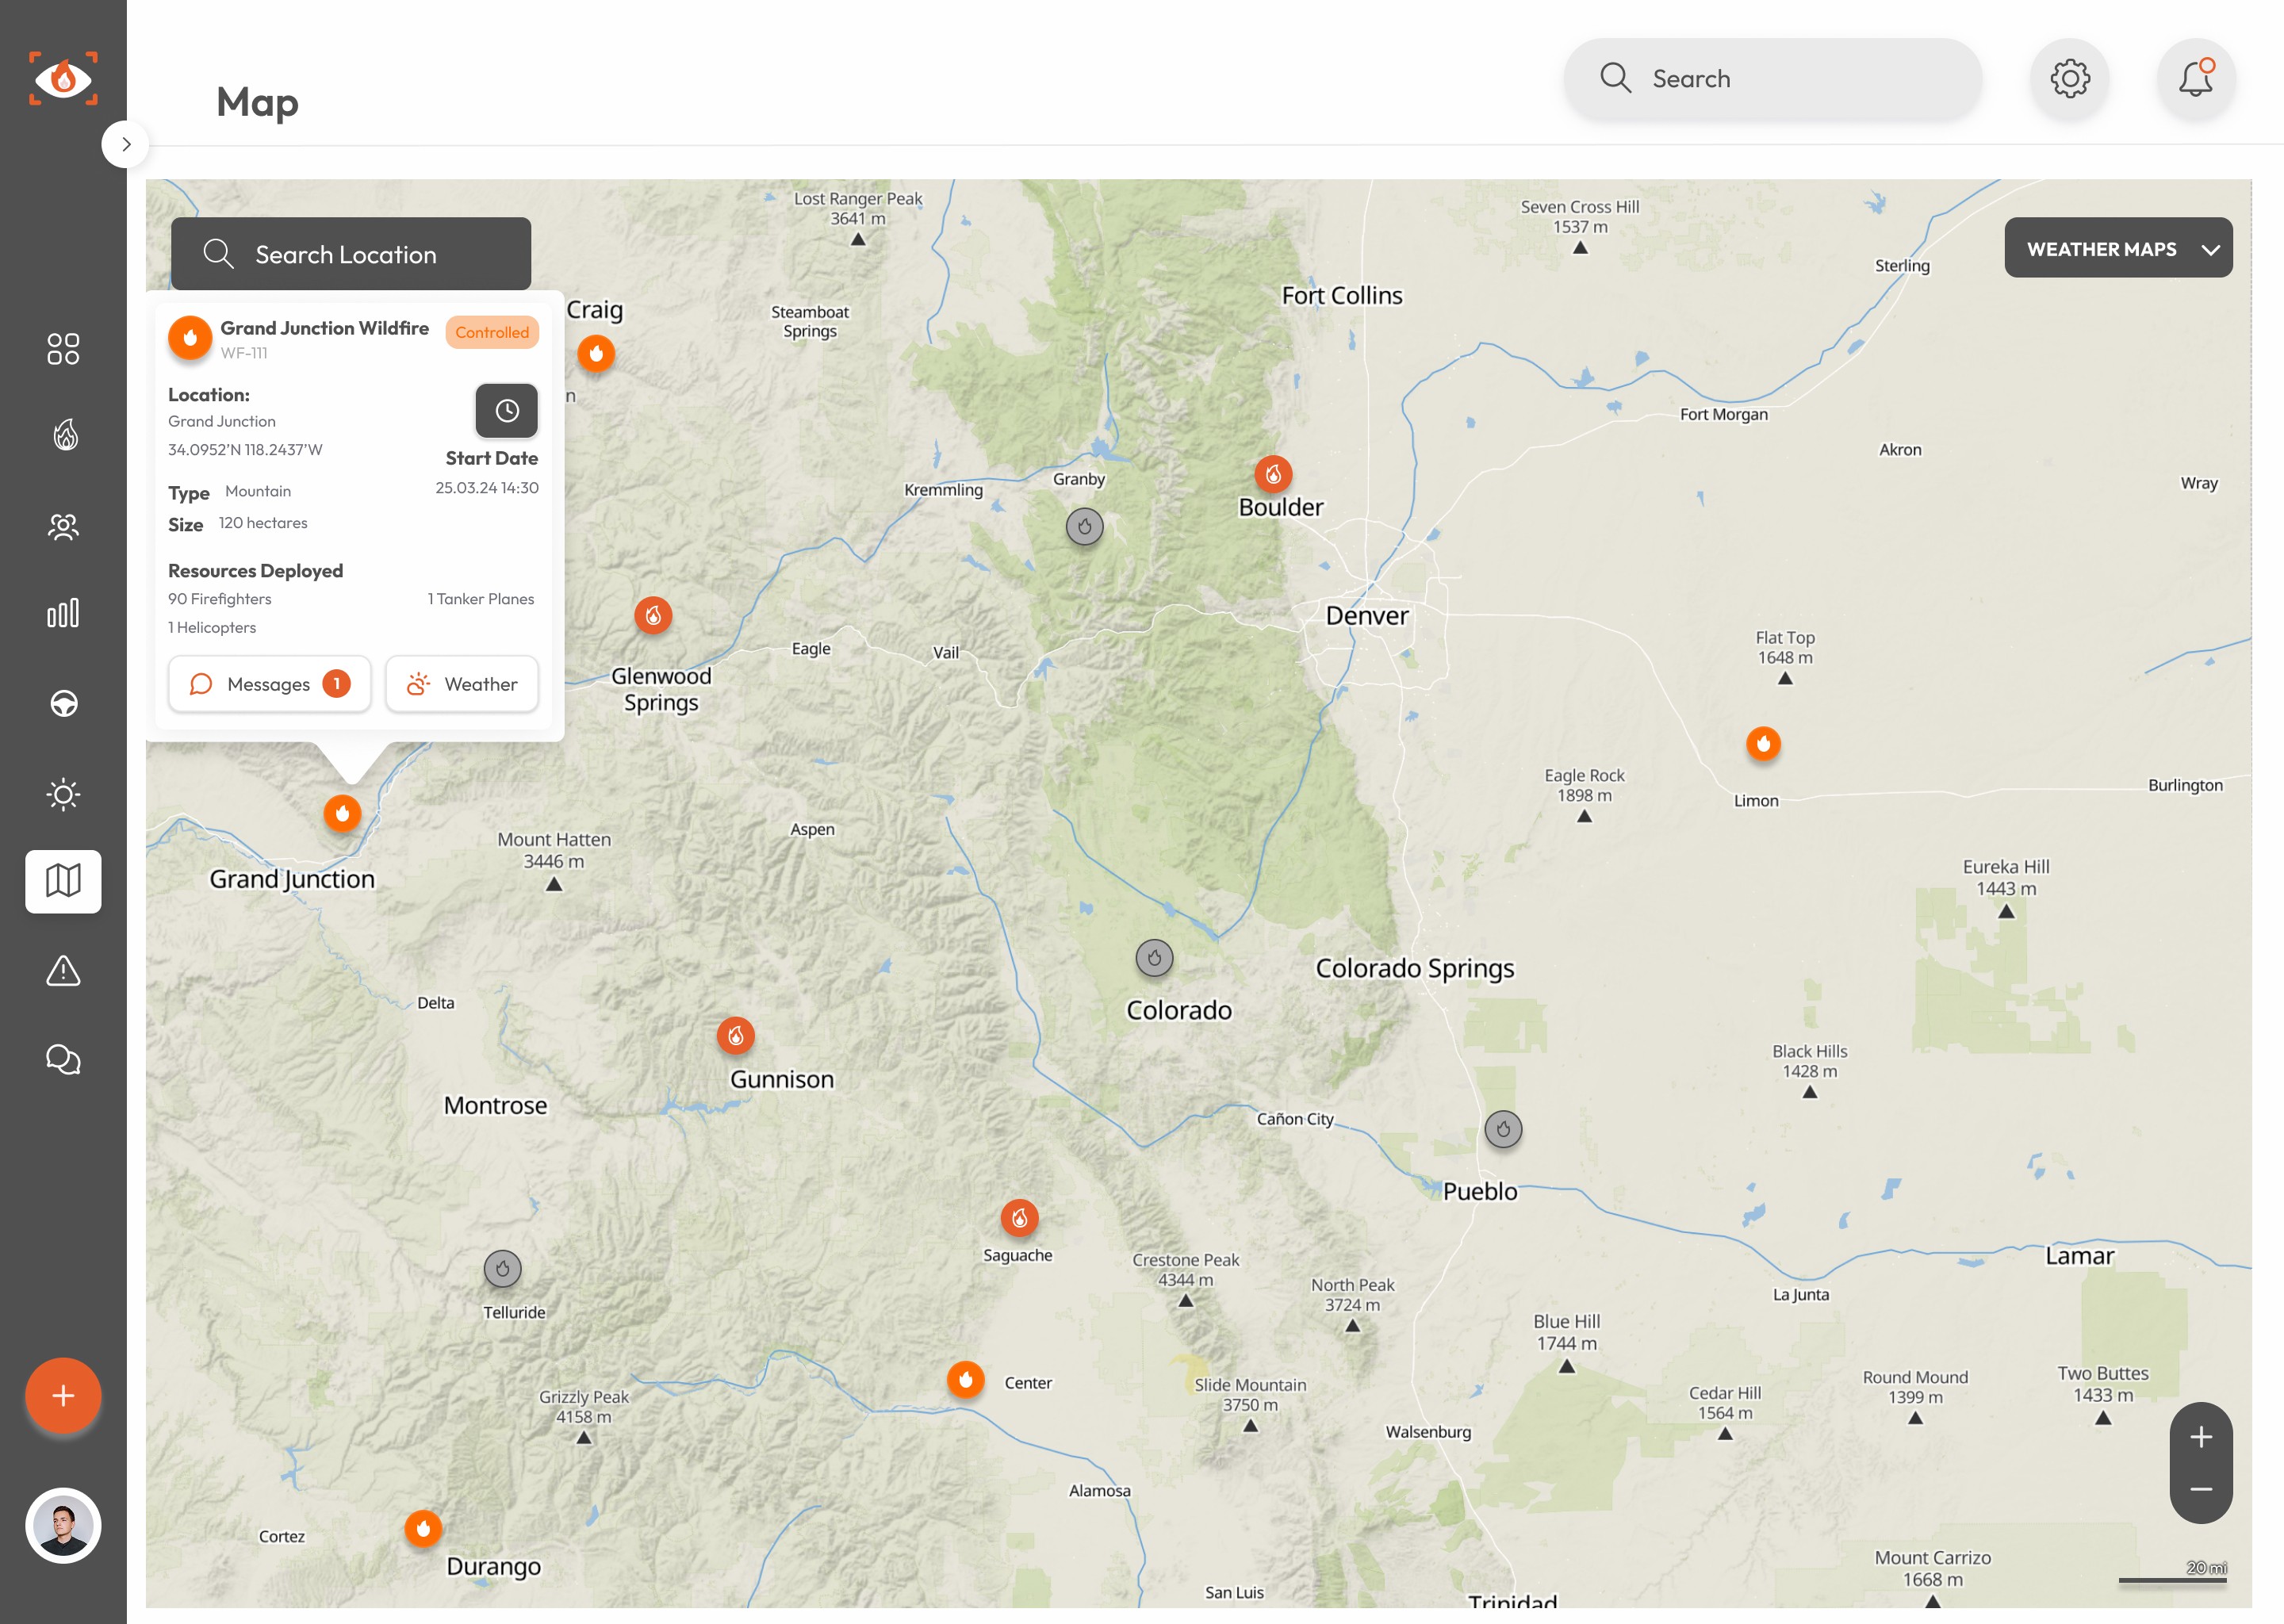
The map isn’t decoration, it’s the main interaction surface. Active incidents, sensor positions, team locations, and resource deployment all live on the map. Users can click any incident to open contextual details without leaving their spatial context.

In wildfire response, losing your sense of where things are means losing situational awareness, so the map is always visible, no matter what panel is open.

BEYOND THE MAP

The map is the entry point, but Flame Tracker includes a full suite of tools that responders interact with every day. Each one maps back to the 5-phase framework.
Weather Intelligence

Wind speed, temperature, and humidity data update in real time alongside each incident. Responders assess weather impact on fire spread without switching tools, and the data feeds directly into the risk scoring system.

Contextual Messaging

The default view shows the map and active incidents, the essential monitoring state. Detail emerges on demand: click an incident to assess, expand the panel to see resources, toggle layers as needed.

Incident Timeline

Every incident generates an automatic timeline logging key events, status changes, and team actions. Field teams and command stay aligned without relying on manual updates or radio check-ins.

Weather Intelligence

Wind speed, temperature, and humidity data update in real time alongside each incident. Responders assess weather impact on fire spread without switching tools, and the data feeds directly into the risk scoring system.

Contextual Messaging

The default view shows the map and active incidents, the essential monitoring state. Detail emerges on demand: click an incident to assess, expand the panel to see resources, toggle layers as needed.

Incident Timeline

Every incident generates an automatic timeline logging key events, status changes, and team actions. Field teams and command stay aligned without relying on manual updates or radio check-ins.

Weather Intelligence

Wind speed, temperature, and humidity data update in real time alongside each incident. Responders assess weather impact on fire spread without switching tools, and the data feeds directly into the risk scoring system.

Contextual Messaging

The default view shows the map and active incidents, the essential monitoring state. Detail emerges on demand: click an incident to assess, expand the panel to see resources, toggle layers as needed.

Incident Timeline

Every incident generates an automatic timeline logging key events, status changes, and team actions. Field teams and command stay aligned without relying on manual updates or radio check-ins.

MAP CENTERED WILDFIRE TRACKER DASHBOARD

Everything in one place.

The full dashboard brings together monitoring, assessment, resource management, and communication into a single spatial interface. Incident commanders can scan, decide, and act without ever switching tools.

THE DASHBOARD IN DETAIL

Explore each capability.

The Command Dashboard

Contextual messaging

Incident Tracking

Weather Intelligence

Analytics & Reporting

RESULTS

What the Team got.

01Unified DashboardOne interface replacing multiple disconnected tools for monitoring, assessment, and coordination.
02Faster ResponseCritical fire data accessible within seconds instead of cross-referencing between systems.
03Clear Risk AssessmentA structured framework turning complex data into actionable threat levels.
01Unified DashboardOne interface replacing multiple disconnected tools for monitoring, assessment, and coordination.
02Faster ResponseCritical fire data accessible within seconds instead of cross-referencing between systems.
03Clear Risk AssessmentA structured framework turning complex data into actionable threat levels.

REFLECTIONS

What I learned, and what I'd explore next

What worked

Starting with the 5-phase framework gave the project clear structure. Every design decision traced back to one of those operational steps, which made prioritization straightforward and stakeholder conversations productive.

What I'd change

I'd push harder for real field testing earlier. Most validation happened through interviews and walkthroughs, but watching responders use the tool during an actual incident would have revealed interaction patterns we couldn't anticipate.

What worked

Starting with the 5-phase framework gave the project clear structure. Every design decision traced back to one of those operational steps, which made prioritization straightforward and stakeholder conversations productive.

What I'd change

I'd push harder for real field testing earlier. Most validation happened through interviews and walkthroughs, but watching responders use the tool during an actual incident would have revealed interaction patterns we couldn't anticipate.

Two men greeting with hand

I'm available

Let's Connect

Feel free to contact me.
I'm available for new projects or just for chatting.

© Márcia Cerejo, 2026

I'm available

Let's Connect

Feel free to contact me.
I'm available for new projects or just for chatting.

© Márcia Cerejo, 2026

I'm available

Let's Connect

Feel free to contact me.
I'm available for new projects or just for chatting.

© Márcia Cerejo, 2026

Create a free website with Framer, the website builder loved by startups, designers and agencies.